A: A sociogram is a visual tool that maps out the social relationships in a group—in early childhood, this means it shows how the children interact with one another. Think of it as a snapshot of the social network within the learning environment.
How Sociograms Work
-
Nodes and Lines: Each child becomes a "node" (often represented by a circle with their name or photo). Lines between the nodes represent relationships. These can be drawn to indicate, for example, who most often chooses to play with whom or who tends to be left out.
-
Direction and Weight: The lines might be directional (an arrow indicating that one child nominates another) or weighted (thicker lines can denote stronger or more frequent interactions).
Why Use Sociograms in Early Childhood
-
Identifying Social Patterns: Sociograms help educators pinpoint which children are engaging well with peers and who might be more isolated. This can be key in planning inclusive, supportive group activities.
-
Informing Social and Emotional Strategies: If you notice a child consistently on the margins of your sociogram, it may be a signal to create opportunities for guided, one-on-one interactions or group interventions.
-
Enhancing Group Dynamics: By visually mapping out the group’s social interactions, you can plan activities that foster better social integration and ensure balanced group interactions.
Creating a Sociogram Young Children
- Observation-Based Data Collection: For older children, you might ask sociometric questions like “Who do you like to play with?” With infants who can’t verbalize their preferences, you rely on careful observation—tracking who reaches for the same toy or who seeks comfort or engagement with an educator or peer.
-
Charting the Data: Once you’ve collected observations, you can sketch a diagram. Here’s a simple ASCII-style example for a small group of children:
[A]
|
----------------
| | |
(B) (C) (D)
- Interpreting the Diagram: Use the sociogram as a discussion point with colleagues or even with families. It provides a framework to talk about how you’re planning supportive interactions and activities that bridge gaps or strengthen existing bonds.
Moving Further
As you adjust your practice for infants, blending sociograms with other observational tools can be invaluable. While a sociogram offers a clear, visual depiction of social networks, it’s just one part of a holistic review of social/emotional development. It works best when combined with reflective documentation, family insights, and continuous team discussions.
Samples
Example 1: Central Hub Sociogram
In this model, one child (let’s say Child A) acts as a central figure who interacts frequently with most peers. This can indicate a highly sociable or influential child.
[A]
/ | \
[B] [C] [D]
|
[E]
Explanation:
-
Child A is central, showing many interactions and perhaps a strong social role.
-
Child C connects to Child E, suggesting that while A is influential, some responsive friendship building exists between others.
Example 2: Clustered Sociogram
Here, children form two subgroups or clusters, with only a weak link connecting them. This might help you identify potential isolated groups or children who bridge between clusters.
Cluster 1: [A] --- [B]
\
[C]
Weak Link
\
Cluster 2: [D] --- [E]
Alternate ASCII Version:
[A] -- [B]
\
[C] ------ [D] -- [E]
-
Cluster 1 (Children A, B, C) interact closely.
-
Cluster 2 (Children D and E) have a strong bond.
-
The line between C and D indicates a mild interaction that might be developed further to integrate the groups.
Example 3: Directional Relationship Sociogram
Sometimes it’s helpful to denote not just if a connection exists, but also the direction or intensity of the relationship (especially when using sociometric nominations or observations of who “chooses” whom).
↑ ↓
[C] ← [D]
Explanation:
-
Arrow from A to B might indicate that Child A seeks interaction with Child B.
-
Child D directs attention toward Child B while receiving attention from Child C.
-
The arrows help illustrate who is the initiator and who is the recipient of the interactions.
Using These Sociograms
-
Observation-Based Adaptation: You can create these diagrams after gathering information from systematic observations (or even simple sociometric questions with older children). For infants, consider which peers consistently appear in close proximity during play or soothing moments.
-
Planning Interventions: If you notice any children are consistently isolated or on the periphery, the sociogram can guide targeted group activities or partner changes to encourage more balanced social participation.
-
Reflecting Change Over Time: Revisit and update your sociograms periodically. A changing diagram not only reflects social growth but can also inform you about the effectiveness of your strategies in fostering inclusive, responsive interactions.
Integrating sociograms with other observational tools (like anecdotal records and reflective journals) can provide a multidimensional understanding of social development in your group. For instance, if an infant or toddler seems consistently disengaged, you might pair sociogram data with observation notes to tailor small-group activities or one-on-one interactions.
Further Reading
Different Types Of Observation Methods
Observations in Childcare


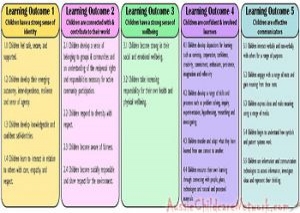 Here is the list of the EYLF Learning Outcomes that you can use as a guide or reference for your documentation and planning. The EYLF
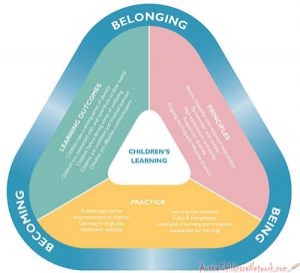 The EYLF is a guide which consists of Principles, Practices and 5 main Learning Outcomes along with each of their sub outcomes, based on identity,
 This is a guide on How to Write a Learning Story. It provides information on What Is A Learning Story, Writing A Learning Story, Sample
 One of the most important types of documentation methods that educators needs to be familiar with are “observations”. Observations are crucial for all early childhood
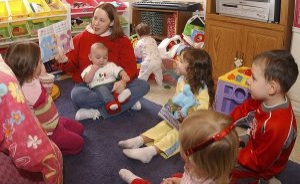 To support children achieve learning outcomes from the EYLF Framework, the following list gives educators examples of how to promote children's learning in each individual
 Reflective practice is learning from everyday situations and issues and concerns that arise which form part of our daily routine while working in an early
 When observing children, it's important that we use a range of different observation methods from running records, learning stories to photographs and work samples. Using
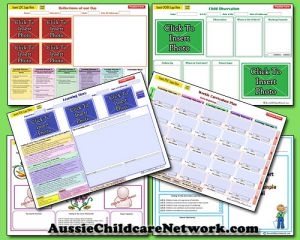 Within Australia, Programming and Planning is reflected and supported by the Early Years Learning Framework. Educators within early childhood settings, use the EYLF to guide
 This is a guide for educators on what to observe under each sub learning outcome from the EYLF Framework, when a child is engaged in
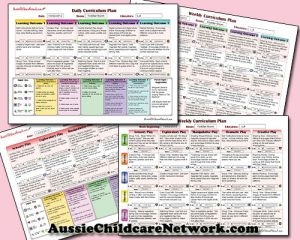 The Early Years Learning Framework describes the curriculum as “all the interactions, experiences, activities, routines and events, planned and unplanned, that occur in an environment